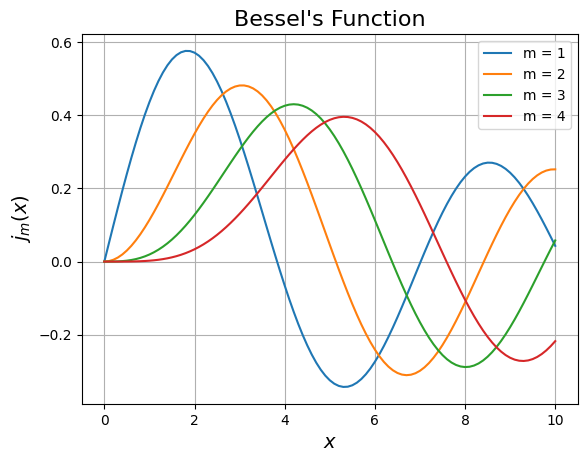
Bessel’s function
\begin{equation} J_m(x)=\frac{1}{\pi}\int_{0}^{\pi}cos(m\theta-xsin\theta)d\theta \end{equation}
[1]:
import numpy as np
import matplotlib.pyplot as plt
[49]:
f = lambda m, x, theta: np.cos(m*theta - x * np.sin(theta))/np.pi

m = np.arange(1, 5, 1)
x = np.linspace(0, 10, 101)
theta = np.linspace(0, np.pi, 101)
h = (theta[-1] - theta[0])/len(theta)

for mval in m:
    intval = []
    for xval in x:
        y = [f(mval, xval, thetaval) for thetaval in theta]
        I = (y[0] + y[-1] + 4*sum(y[1:-1:2]) + 2*sum(y[2:-2:2]))*(h/3)
        intval.append(I)
    plt.plot(x, intval, label = "m = "+str(mval))
plt.legend()
plt.title("Bessel's Function", fontsize = 16)
plt.xlabel("$x$", fontsize =14)
plt.ylabel("$j_m(x)$", fontsize =14)
plt.grid()
plt.show()